Why History Points to a Property Low in Early 2027

Markets do not repeat, but they rhyme. Right now, one of the most reliable rhythms in modern market history is pointing toward a familiar destination: a low somewhere between this autumn and early 2027.
The pattern is the midterm election year, and because Hong Kong sits downstream of the same monetary tide, it matters here too.
The Midterm Pattern Is Remarkably Consistent
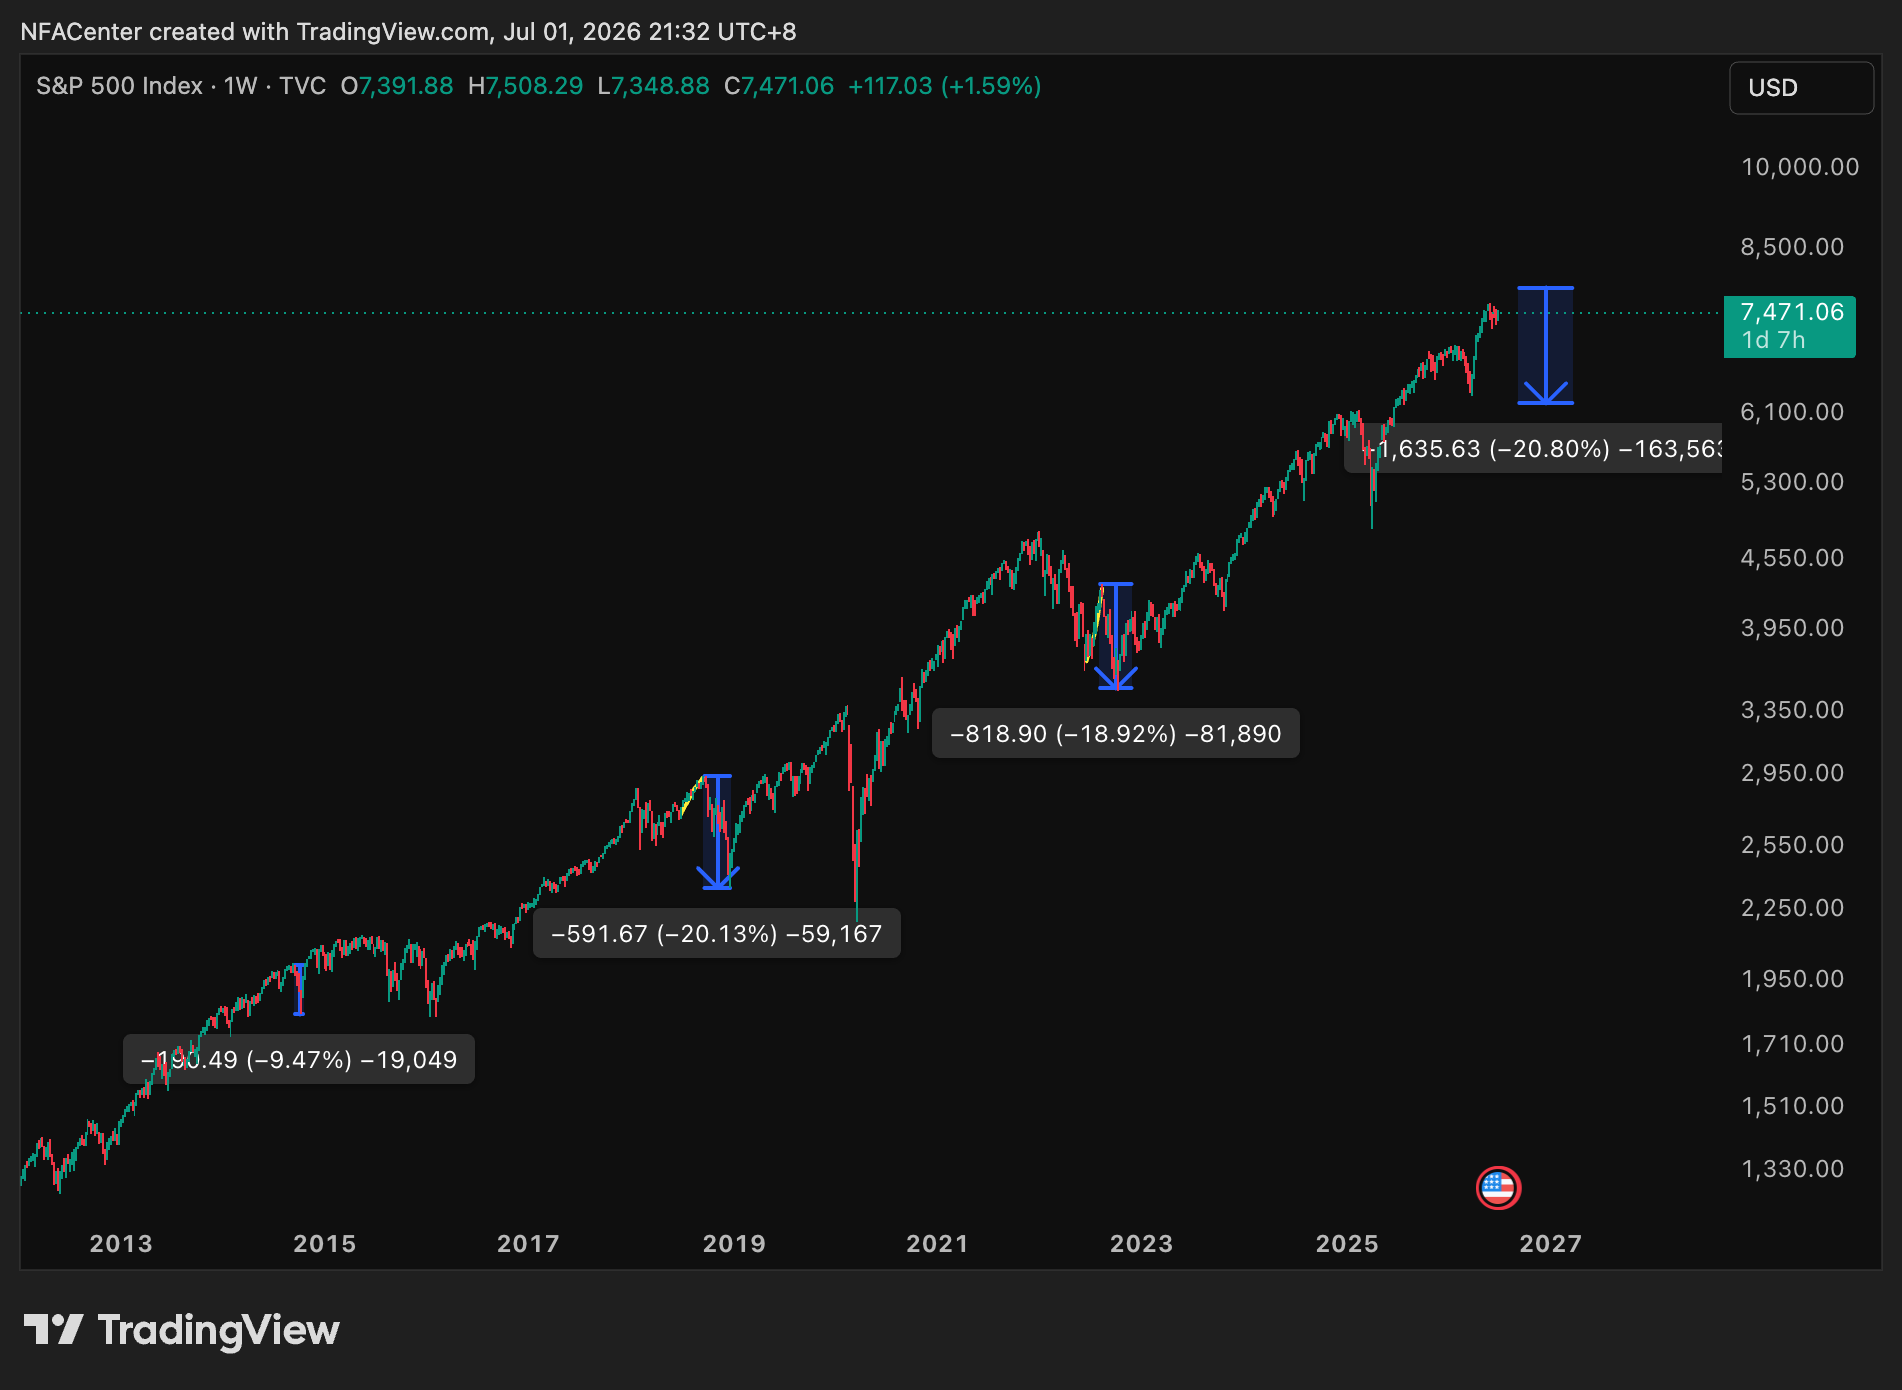
Look at the last three US midterm years. In 2014, the S&P 500 fell about 9.5% from May peak to trough. In 2018, it dropped nearly 19%, culminating in a brutal December. In 2022, it declined roughly 20% into an outright bear market.
The magnitudes differ, but the timing does not. In each case the low arrived in the second half of the year, clustered in the third and fourth quarters, before a powerful rebound once the election uncertainty cleared. Down into the autumn, up after the vote. That is the rhythm, and it has held with unusual reliability.
Why 2026 Rhymes Louder
This year the seasonal pattern is not acting alone. Monetary policy is pointing in the same direction.
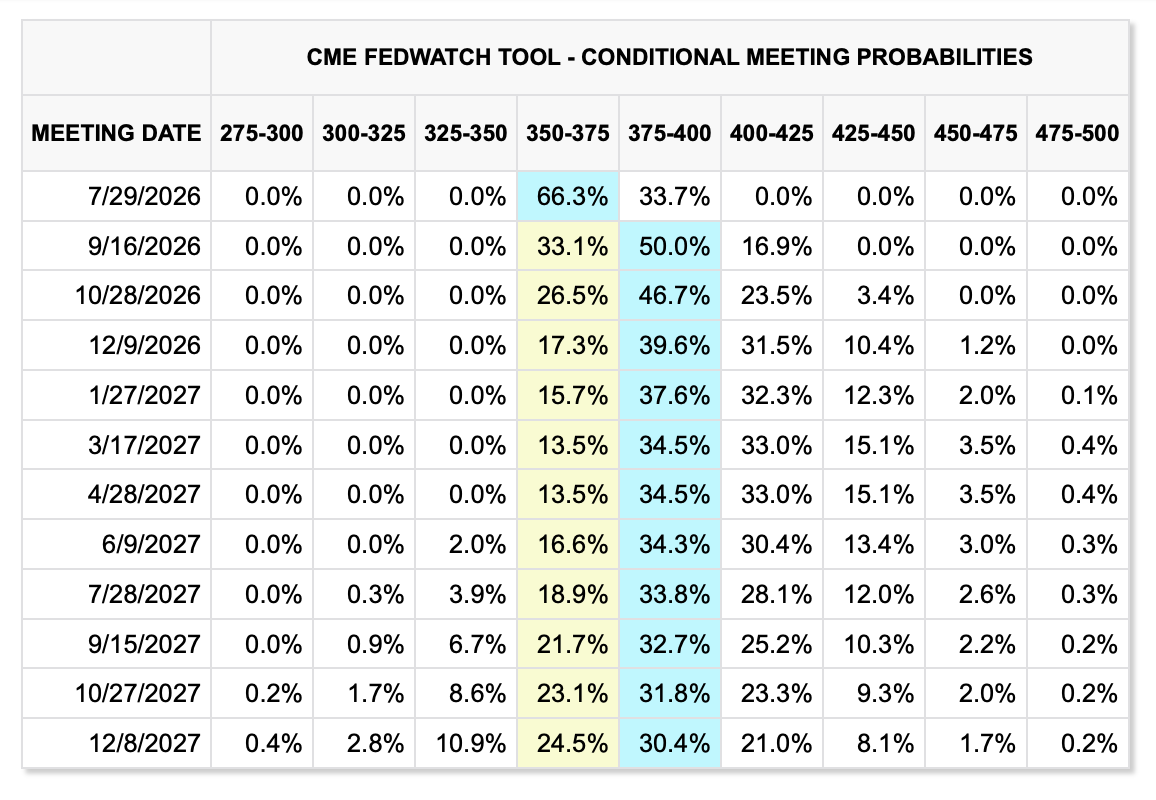
The CME FedWatch tool now assigns a 50% probability to a rate hike at the September meeting, lifting the Fed Funds Rate toward 3.75% to 4.00%, with further tightening priced into late 2026 and 2027. The bond market is already leaning that way. The 2-year Treasury yield sits at 4.17%, comfortably above the current policy rate. When the 2-year runs this far ahead, the Fed has historically followed.
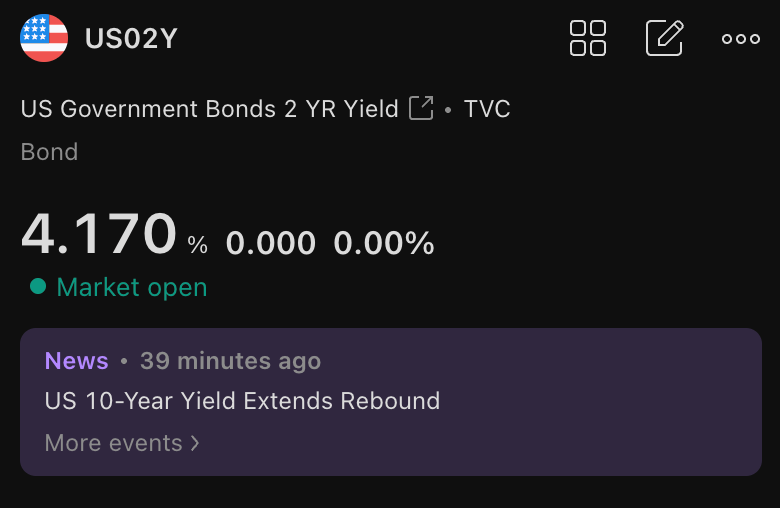
So the calendar and the rate cycle align. A midterm year that historically bottoms in autumn, meeting a Fed that may be tightening into that exact window.
Hong Kong Is Already Tracing the Pattern
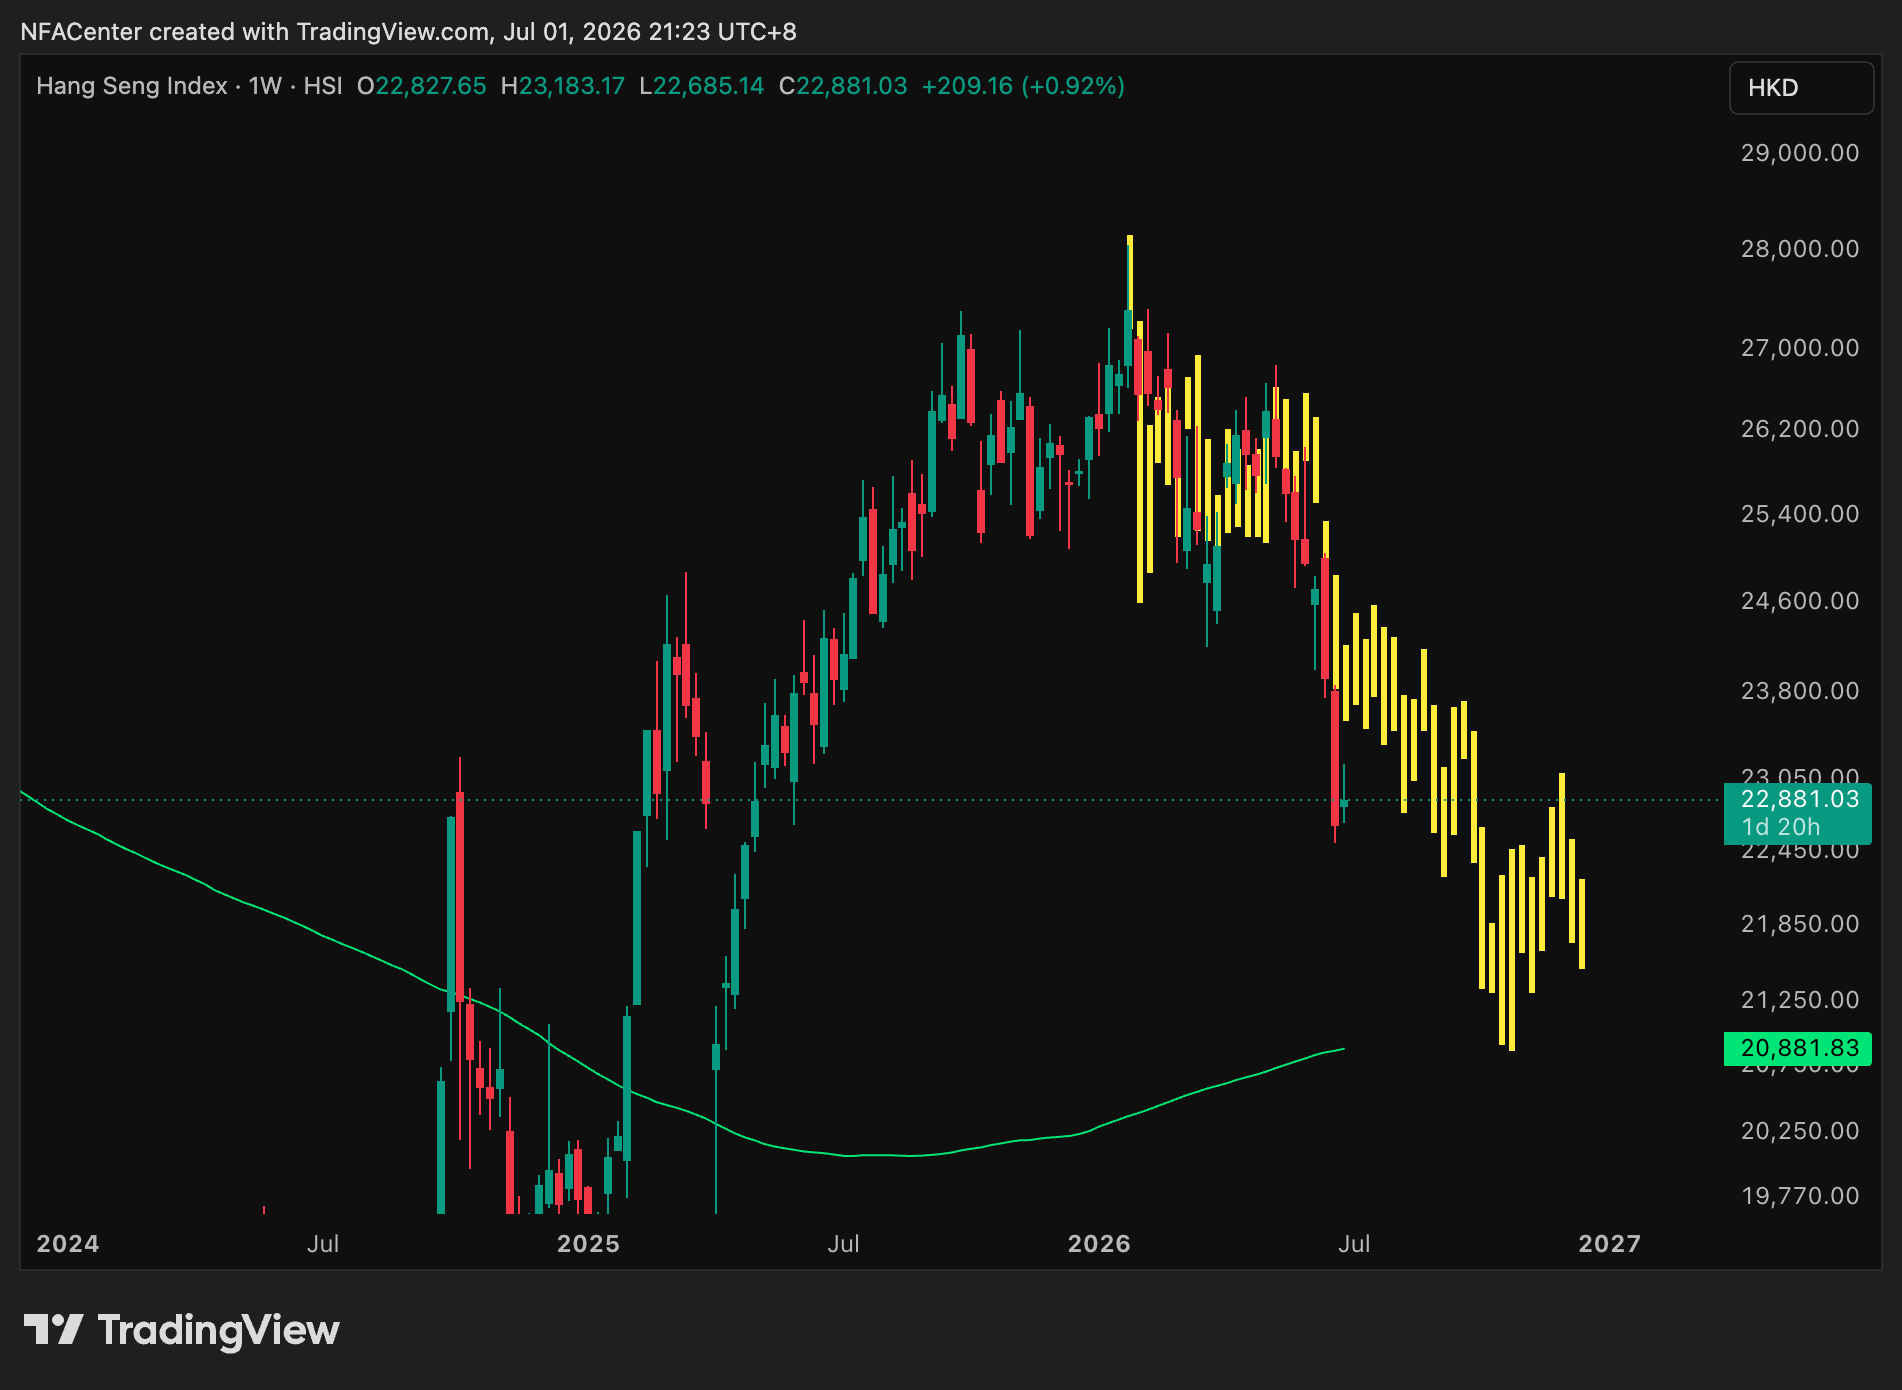
Here is what makes this more than theory. Look at a chart of the Hang Seng Index today, and the shape rhymes closely with 2018. The index peaked above 28,000 earlier this year and has been grinding lower since, in a formation that looks strikingly similar to the roll-over that preceded the late-2018 decline.
If the parallel holds, the next reference point is the 200-week moving average, currently sitting near 21,000. That is the level long-term buyers tend to watch, and the pattern suggests Hong Kong equities could test it into the back half of the third quarter.
Hong Kong does not vote in US midterms, but its mortgage rates answer to the same Fed, and its equity market is already moving to the same rhythm.
What It Means for Property
This is why I expect Hong Kong residential prices to find their low somewhere in the window from the fourth quarter of 2026 into the first quarter of 2027.
The summer is already quiet. Price cutting is likely to arrive by the end of the third quarter, as developers carrying rate-linked debt grow less willing to hold inventory into a higher-cost winter. If equities test their lows into the autumn and the Fed tightens as the futures market expects, that pressure on property intensifies before it eases.
The Bottom Line
The value of a pattern is not precision. It is preparation. History does not promise that 2026 will trace the midterm script exactly, and anyone who treats a seasonal tendency as a guarantee will eventually be humbled.
But when a reliable calendar pattern, a hawkish rate cycle, and a local market already tracing the shape all point toward the same few months, it is worth paying attention. The low is not a moment to fear. For those who have kept their patience and their capital, it may be the most interesting window in the cycle.